Mathieu Lalumiere, Martine Blouin, Felix Chenier, Rachid Aissaoui, Dany H. Gagnon
School of Rehabilitation, Université de Montréal, Montreal, Quebec, Canada
École de Technologie Supérieure, Montreal, Quebec, Canada
abstract
A repeated cross-sectional research design was used in this study to compare propulsion biomechanics on a newly developed wheelchair simulator to overground natural propulsion. Seventeen individuals (15 men and 2 women) with spinal cord injury between T4 and T12 completed two 20-meter propulsion trials on a tiled surface and two 1-minute propulsion sessions on the simulator. The main outcome measures were perceived exertion, spatio-temporal and pushrim kinetic propulsion parameters. In conclusion, the propulsion biomechanic patterns on the simulator are comparable to overground propulsion.
Background
Individuals with spinal cord injury (SCI) who have lower limb paralysis generally use a manual wheelchair (MWC) as their primary means of mobility. The extensive use of the upper limb (U/L) for locomotion such as repetitive propulsion patterns have been previously correlated to a high prevalence of U/L injury in this population. Between 30% and 60% of MWC users are likely to develop shoulder pain during lifetime, between 5% and 16 % elbow pain, and between 15% and 48% hand and wrist pain (Paralyzed Veterans of America Consortium for Spinal Cord Medicine, 2005). In clinical practice, MWC simulators such as dynamometers have been used for a long time for task specific training programs. Similarities between overground and dynamometer propulsion have already been highlighted (Koontz, Worobey, Rice, Collinger, & Boninger, 2012). The general conclusion is that, even if dynamometers do not perfectly emulate overground propulsion, manual wheelchair users are consistent in their propulsion patterns, such as push angle, stroke frequency, direction and amplitude of forces applied at the handrim and timing.
Looking at the promising results from other SCI training programs that resulted in improved function, quality of life, propulsion mechanical efficiency, muscular endurance and cardiorespiratory capacity (Devillard, Rimaud, Roche, & Calmels, 2007), a new motorized simulator was developed (Chenier, Bigras, & Aissaoui, 2013). Unlike other dynamometers, this simulator uses motor-driven rollers controlled by a real-time computer. The computer simulates the behaviour of a virtual wheelchair in its natural environment (e.g. velocity and slope changes) and thus can be configured to simulate the real inertia and rolling resistance of the user and wheelchair.
purpose
The goal of this study was to compare the propulsion of this newly developed simulator to overground propulsion on a tiled surface at a self-selected natural velocity. The comparison was based on spatio-temporal and biomechanical parameters as well as perceived exertion among a group of experienced MWC users with SCI. It was hypothesized that the simulator would emulate overground wheelchair propulsion key outcome measures at self-selected natural velocity.
Method
Participants
Seventeen individuals (15 men and 2 women) with a spinal cord injury located between T4 and T12 were contacted by phone or email from an internal subject database and accepted to participate in this study. Mean ± s.d. age was 43.5 ± 13.9 years, height was 1.73 ± 0.21 meters, weight was 79.4 ± 15.3 kg, and time since their injury was 14.0 ± 9.2 years. Inclusion criteria were having been diagnosed with SCI at least one year prior to the study, using a manual wheelchair as a primary means of mobility (>4hours/day) and having no or minimal pain at the shoulder which could limit the ability to propel their wheelchair. Participants were excluded if they had associated neurological or musculoskeletal impairments or any other disability that could have hindered their ability to carry out the experimental tasks. They were also excluded if they could not properly fit in the wheelchair simulator due to their weight, height or cushion width. Ethical approval was obtained from the Centre for Interdisciplinary Research in Rehabilitation of Greater Montreal (CRIR) and the École de Technologie Supérieure (ÉTS) Research Ethics Committees. Participants reviewed and signed informed consent forms and the PAR-Q form (www.csep.ca) before entering the study.
Overground propulsion setting
Participants first performed a MWC propulsion trial over a distance of 20 meters in a corridor (tiled surface) with their own wheelchair at a self-selected natural velocity. The trial was done twice, unless there was a velocity variation exceeding 10%, in which case a third trial was completed. The time needed to travel the required distance was measured with a stopwatch, which was started when the front wheels began to move and stopped when the wheels crossed the finish line. A rest period was allowed before each trial as required.
Simulator propulsion setting
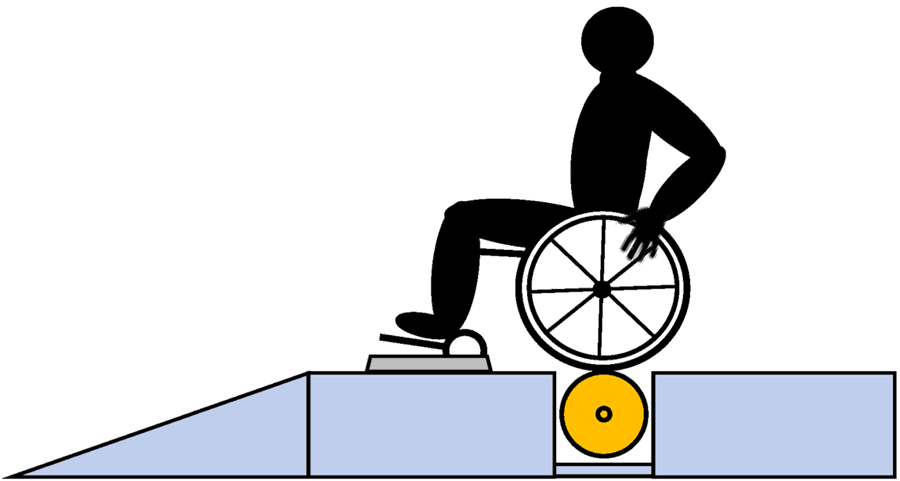 Figure 1: Lateral view of a schematic representation of the experimental setup on the simulator.
The participants were transferred from their own wheelchair to a manual wheelchair customized to fit on the simulator (seat width=44 cm, seat height from ground= 57 cm, diameter of wheels = 24", Figure 1).
The wheelchair was completely stabilized by a front wheel and rear axle locking device. The backrest angle was adjusted to fit the specifications of the participants' wheelchairs and, if desired, the participants could use their own cushion. A familiarization period, consisting of 5
three-minute propulsion periods followed by two minutes of rest, was completed. Then, 2 one-minute propulsion trials were conducted on the simulator at the participants’ self-selected natural velocity, corresponding to the same perceived effort as that reported during overground propulsion. After each task, the participant expressed their perceived exertion using the modified BORG scale ranging from 0 (no effort) to 10 (maximum effort).
Handrim kinetics
In both settings, the wheelchairs were equipped with two instrumented wheels to record the forces and moments applied at the handrims at 240 Hz equipped with instrumented wheels (SmartWheel; wheels diameter=24"; Out-Front, Mesa, Az, USA). Once installed on the participant’s wheelchair, these instrumented wheels did not significantly alter the wheelchair's characteristics (width, position, size and orientation of the wheels) aside from the overall weight of the wheelchair (SmartWheel=4.9 kg/wheel) and additional rolling resistance due to the different tire construction (SmartWheels were fitted with solid tires whereas most participants used inflatable tires). The instrumented wheels allowed us to calculate the spatio-temporal variables and force applied to the MWC pushrim bilaterally. Force and moment data were filtered using a zero-lag eighth-order low-pass Butterworth filter with a cut-off frequency of 30 Hz.
Main outcome measures
To facilitate data analysis, MWC propulsion cycle was divided into two distinct phases: push and recovery phases(Kwarciak et al., 2009). Thresholds of 15 N and 5N were applied on the total force to respectively detect the beginning and the end of the push phase. The kinetic data collected during the push phase were analyzed and normalized over the push angle between 0% and 100%.
The total force (Ftot) was determined by computing the vectorial sum of the individual forces (Fx, Fy, Fz) measured at the handrims bilaterally. The tangential force (Ftg) was obtained using the ratio between the wheel's axial moment (Mz) and the wheel's radius (Robertson, Boninger, Cooper, & Shimada, 1996). The mechanical effective force (MEF), which is the proportion of the force applied to the pushrim directly contributing to the forward rotation of the wheel expressed as a percentage, was calculated using [Ftg2 /Ftot2]*100. The moment Mz was obtained directly by the SmartWheels sensors; the power was calculated using Mz*ω, where ω is the angular velocity in radian per second. Ftot, Ftg, MEF and power measures were time-normalized (0%-100%) over the push phase of each trial for each participant. These main outcome measures were selected as they are likely related to the development of secondary musculoskeletal impairments affecting the U/Ls among wheelchair users (Paralyzed Veterans of America Consortium for Spinal Cord Medicine, 2005)
Statistical analysis
Mean and standard deviations (SD) were calculated for the participants’ demographic and clinical characteristics (Table 1) as well as for all outcome measures at the dominant side (Table 2). . For each of the simulator and overground settings, 2 trials were evaluated, with 5 propulsion cycle considered for each trial (total=10 propulsion cycles). The propulsion cycles were selected as strokes 4 to 9 of each trial. After confirming the normality of the data distribution by a Shapiro-Wilk test, paired t-tests were used to verify whether differences existed between simulator and overground propulsion main outcome measures.
Pearson correlation coefficients (r) were used to analyze similarity between time-normalized profiles of Ftot, Ftg, MEF and power were achieved overground and on the simulator for each participant and a group mean was calculated. The group mean r value obtained for each outcome measure was interpreted according to the guidelines proposed by Altman (1991): poor agreement (r≤0.20), fair (r=0.21-0.40), moderate (r=0.41-0.60), good (r=0.61-0.80) and very good (r≥0.81). Statistical significance level was set to α=0.05 for all tests. Statistical analyses were performed with SPSS v.20 software.
RESULTS
Comparison between simulator and overground propulsion
Group mean (s.d.) spatio-temporal parameters, handrim kinetic parameters and BORG exertion scale value were calculated on the simulator and overground settings at the participant’s self-selected natural velocity (Table 2). The handrim kinetics time-normalized profiles with mean and maximal values are presented in Figure 2.
Natural velocity |
|
|
||
Variables |
Overground |
Simulator |
Differences (%) |
|
|---|---|---|---|---|
| Mean velocity (m/s) | 1.57 (0.31) | 1.20 (0.19) | -23.8% | ∗∗∗ |
| Peak velocity (m/s) | 1.66 (0.30) | 1.24 (0.19) | -25.2% | ∗∗∗ |
| Contact angle (°) | 87.42 (15.47) | 74.17 (16.83) | -15.2% | ∗∗ |
| Mean Ftot (N) | 43.40 (12.15) | 38.11 (9.00) | -12.2% | ∗ |
| Peak Ftot (N) | 70.63 (22.15) | 56.28 (15.84) | -20.3% | ∗∗ |
| Mean Ftg (N) | 26.26 (8.95) | 23.92 (6.17) | -8.9% | |
| Peak Ftg (N) | 44.79 (15.81) | 39.36 (10.85) | -12.1% | |
| Mean MEF | 0.40 (0.11) | 0.43 (0.11) | 7.7% | |
| Peak MEF | 0.71 (0.14) | 0.79 (0.12) | 11.8% | ∗ |
| Mean Power (W) | 36.90 (16.30) | 26.14 (8.65) | -29.2% | ∗∗ |
| Peak Power (W) | 67.54 (29.61) | 49.04 (16.60) | -27.4% | ∗ |
| BORG exertion (/10) | 2.46 (0.82) | 2.79 (1.21) | 13.8% | |
| * Significant difference(* p < 0.05, ** p < 0.01, *** p < 0.001) between overground and simulator setting. | ||||
Spatio-temporal parameters
Velocity and contact angle were found to be significantly different between overground and simulator propulsion at a self-selected natural velocity (Table 2).
Pushrim kinetics and BORG exertion scale
Mean and peak Ftot, power, and peak MEF were found to be significantly different, whereas mean and peak Ftg, mean MEF and perceived exertion were found to be similar between simulator and overground propulsion at their self-selected natural velocity (Table 2).
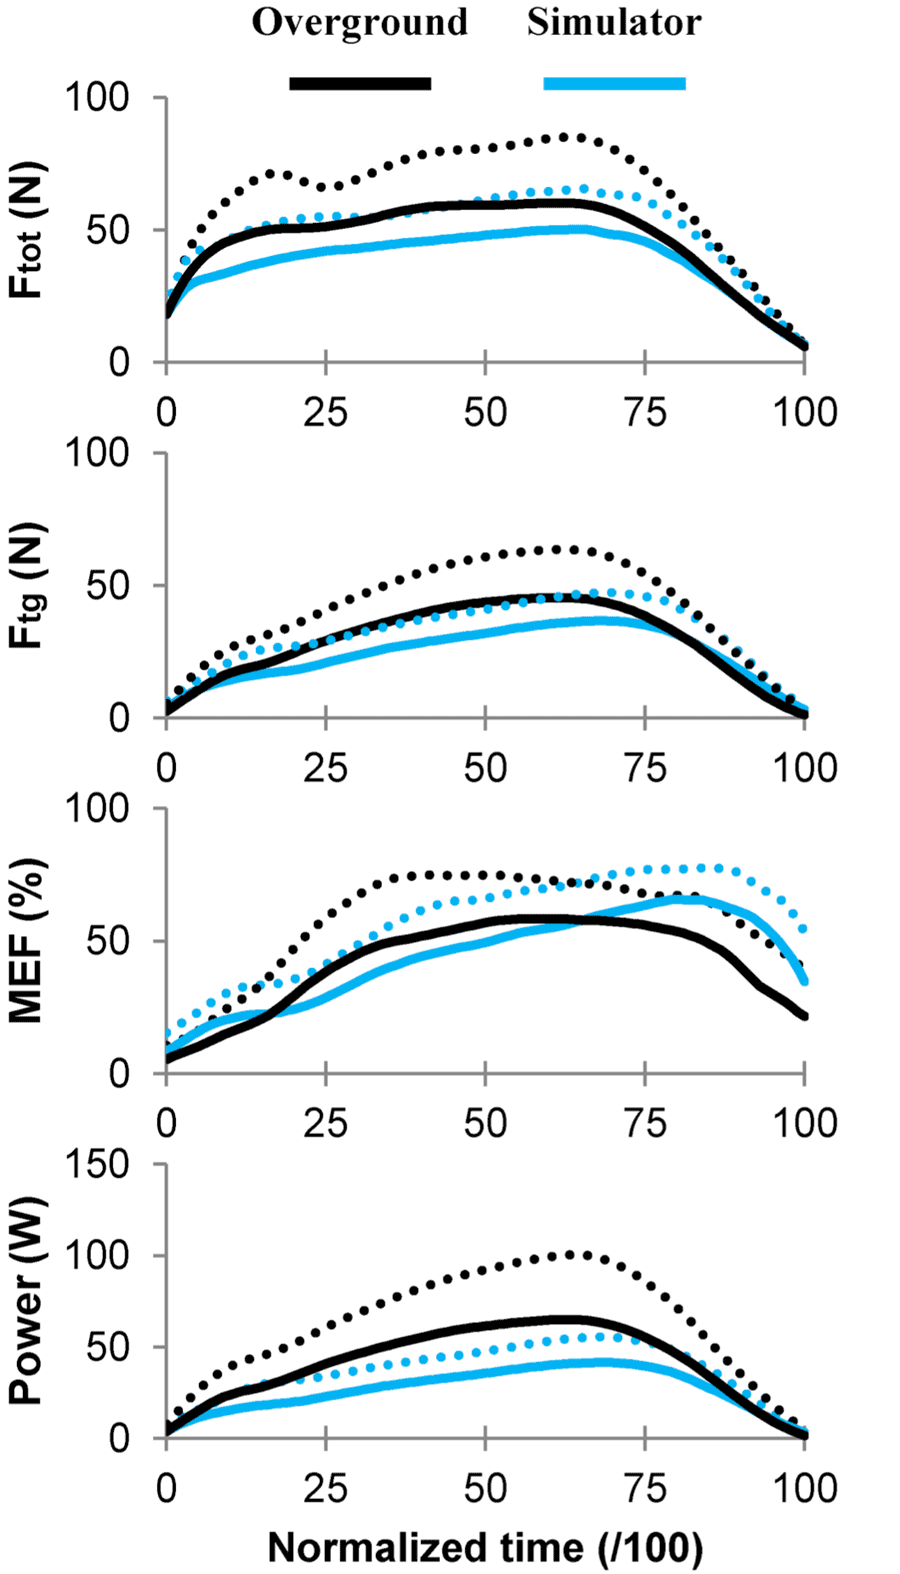 Figure 2: Mean (solid lines) + s.d. (dotted lines) of the main outcome measures for overground (black line) and simulator (light blue line) propulsion settings.
As shown in Figure 2, the general trends show similar profiles between simulator and the overground handrim kinetics with peak values occuring between 50% and 75% of the push phase for Ftot, Ftg and power. MEF peak occurred between 50% and 75% of the push phase in the overground setting and between 75% and 100% in the simulator setting. Correlation was found to be "very good" for Ftot(r=0.89), Ftg (r=0.91) and power (r=0.90), and "good" for the MEF (r=0.76) value.
DISCUSSION
Velocity was lower on simulator than overground
Adoption of a lower self-selected natural velocity on simulators compared to the overground has already been noticed and documented in other studies on gait locomotion using treadmills (Mohler, Thompson, Creem-Regehr, Pick Jr, & Warren Jr, 2007), and was explained by the lack of visual flow, which contributes to the calibration of propulsion mechanical and energetic aspects. The absence of visual flow could alter the control of the locomotive behavior and influence the velocity of the wheelchair displacement seen in this study.
Also, the velocity difference could have been influenced by the change in wheelchair design, as it could have altered the participants’ propulsion biomechanics. When propelling on the simulator, participants could have increased muscular efforts (increased muscular co-contractions) resulting in increased perceived effort for similar velocities. As participants were asked to propel with similar perceived effort, velocity on the simulator was decreased to comply with the instructions. The increased overground velocity was associated with increased forces (F![]() tot, F
tot, F![]() tg) and power output, as previously described during manual wheelchair propulsion (Koontz, Cooper, Boninger, Souza, & Fay, 2002), even if perceived effort was similar.
tg) and power output, as previously described during manual wheelchair propulsion (Koontz, Cooper, Boninger, Souza, & Fay, 2002), even if perceived effort was similar.
Propulsion patterns comparable between simulator and overground propulsion settings
Mean curve profiles were found to be similar for total force, tangential force, power and MEF. The "good" to "very good" correlation between simulator and overground propulsion could be associated with similar propulsion technique, which could be associated with similar neuromuscular behaviour when comparing both conditions. On the other hand, total force intensity and velocity were found to be different between the simulator and overground setting, indicating that the simulator does not perfectly emulate overground propulsion. These differences need to be taken into account when combining practical guidelines (based on ergometers and dynamometers studies) with real life propulsion situations (Paralyzed Veterans of America Consortium for Spinal Cord Medicine, 2005). To optimize rehabilitation, protocols could include hybrid training involving propulsion on both dynamometers and overground. Propulsion training on dynamometers can be useful during intensive rehabilitation to minimize some risks associated with outdoor propulsion, such as being stuck in snow or on ice. It can also contribute to train wheelchair user propulsion techniques and cardio-respiratory conditioning during longer periods.
Study limitations
The most significant limitation of this study was that participants did not use their own wheelchair on the simulator, which may have altered their mechanical behavior and output measures. Furthermore, because of the increased weight compared with most wheelchair wheels, instrumented Smartwheels may have altered rolling resistance and consequently the participants’ usual overground performance.
CONCLUSION
This study compared wheelchair propulsion biomechanics of manual wheelchair users when propelling on a novel wheelchair simulator versus overground. The results confirm that the propulsion biomechanics on the simulator can be compared to those overground in terms of mechanical propulsion profiles, but that the simulator does not perfectly emulate overground propulsion in terms of spatio-temporal parameters and total force intensity. Current developments are being made to improve the simulator, including the integration of a more immersive way of propulsion with visual feedback, and development of a mechanical system to fit the participants’ own wheelchair on the simulator.
REFERENCES
Altmann, D. (1991). Practical statistics for medical research. CRC: Chapman and Hall. 616p.
Robertson, R. N., Boninger, M. L., Cooper, R. A., & Shimada, S. D. (1996). Pushrim forces and joint kinetics during wheelchair propulsion. Archives of Physical Medicine and Rehabilitation, 77(9), 856-864.ACKNOWLEDGEMENTs
The authors would like to thank Gerald Parent for his contribution to this project. Mathieu Lalumiere received a Summer Research Award from the Canadian Institute of Health Research (CIHR) and a Master’s level research scholarship from Fonds de recherche du Québec en Santé (FRQS) to work on this project. Dany Gagnon holds a Junior 1 Research Career Award from FRSQ. Dany Gagnon and Rachid Aissaoui are members of SensoriMotor Rehabilitation Research Team . We also wish to thank the Lindsay Rehabilitation Hospital Foundation for funding this project.
Audio Version PDF Version